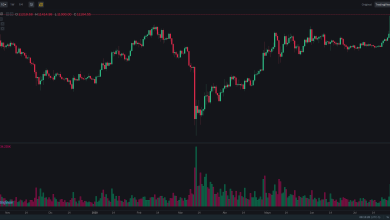
Bitcoin’s recent price pullback has brought attention to a key technical level: $82,000. Analysts say this zone is critical for bulls who hope to maintain upward momentum. The cryptocurrency market operates under a complex interplay of technical indicators, macroeconomic trends, and investor sentiment.
What Happened to Bitcoin This Week?
Bitcoin has pulled back from a previous high, testing the $82,000 to $83,000 zone. This area is not arbitrary—it is a historically significant level that has repeatedly acted as a pivot point in Bitcoin’s price action.
Traders have observed that Bitcoin is now hovering near the $82,000 mark, which has triggered increased attention from both retail and institutional investors. The behavior of price movement in this zone is significant because it represents a potential turning point. If the price breaks below $82,000, it may signal a loss of confidence in near-term bullish momentum, potentially leading to a deeper correction.
Why the $82,000 Level Matters
The $82,000 zone is considered a support level in technical analysis. Support refers to a price point at which buying pressure is expected to outweigh selling pressure, preventing further declines. This concept is rooted in the idea that when an asset reaches a previous high, it often acts as a psychological barrier—investors may be reluctant to sell at that level, and buyers may step in to prevent a drop.
Bitcoin struggled to break above $82,000 in May and again in early September. Once it finally did, that level became the line buyers are expected to defend.


Technical Significance of the Double Top Pattern
A double top is a classic reversal pattern that forms when a price reaches a level twice and fails to break above it. In Bitcoin’s case, the double top at $82,000 suggests that buyers were unable to sustain demand at that price point on two separate occasions. This pattern is often interpreted as a warning sign that a reversal may be imminent. When such a pattern is confirmed with volume spikes or a breakdown, it can trigger a cascade of selling activity, especially among retail investors who may have entered positions at the peak.
While double tops are not infallible, they are widely used in market analysis because they reflect a consensus among traders that a level has been breached in terms of demand. The presence of this pattern at $82,000 adds weight to the idea that a break below this level could initiate a downward spiral, especially if it is confirmed by volume and sustained price action.
Analyst Views on the Level
- Jeff Anderson, head of U.S. at STS Digital, says: “The level to watch is $82k.” He sees a breakdown as likely to push prices into a lower range. Anderson emphasizes that the recent weakness is not due to Bitcoin’s intrinsic value but rather to broader macroeconomic forces, particularly rising U.S. Treasury yields.
- Lacie Zhang, research analyst at Bitget Wallet, identifies the $81,500 to $83,000 zone as key. She says holding it would keep market structure constructive. Zhang notes that if this zone is lost, it could signal a deeper correction, especially if it coincides with negative ETF flows and rising bond yields.
- Iliya Kalchei, analyst at Nexo Dispatch, notes that a sustained break below $80,000 would suggest the market is not yet ready for a rise. He cautions that such a break would require significant shifts in investor sentiment and macroeconomic conditions to be reversed.
What Drives the Market Outlook?
Market forces beyond price charts are influencing Bitcoin’s direction. One of the most significant drivers is the performance of U.S. Treasury yields. As bond yields rise, the opportunity cost of holding riskier assets like Bitcoin increases. Investors may prefer the safety and stability of government bonds over volatile digital assets, especially during periods of economic uncertainty.
Jeff Anderson attributes recent weakness to bond market volatility. He states: “Current softness this week is a direct result of yield markets unravelling and volatility exploding in fixed income space.” This observation highlights a key dynamic: when safe-haven assets like U.S. Treasuries become more attractive due to higher yields, risk assets such as Bitcoin face downward pressure.

Key Market Indicators
- ETF Flows: Spot Bitcoin exchange-traded funds (ETFs) track money moving in and out of the market. Sustained outflows from these funds indicate that institutional investors are pulling back, which can signal weakening demand and reduce bullish momentum.
- 10-Year Treasury Yield: A rising yield on the 10-year U.S. Treasury note increases the appeal of traditional assets. This shift can reduce the demand for crypto, as investors seek safer, more predictable returns.
- Personal Consumption Expenditures (PCE) Index: This inflation gauge, favored by the Federal Reserve, reflects expectations about future inflation. If inflation remains high, it may support Bitcoin’s long-term appeal as a hedge against currency devaluation. Conversely, if inflation cools, it could lead to a broader retreat from risk assets.
What to Watch Next
Bitcoin’s next move may not come from charts alone. Analysts are increasingly turning to macroeconomic data as a guide for future price action. Jeff Anderson notes that the PCE index will be the market’s next key signal. This index provides insight into inflation expectations and can influence investor confidence in both financial and crypto markets.
Traders are now watching for three warning signs: negative ETF flows for several consecutive sessions, a sustained rise in the 10-year Treasury yield, and a failure to hold the $82,000 support level. If all three occur, it could signal a shift from bullish to bearish sentiment, potentially leading to a deeper correction.
Limitations of the Current Outlook
The analysis is based on technical patterns and macroeconomic trends. However, it does not account for changes in regulatory policy, institutional adoption, or macroeconomic shocks. For instance, a sudden change in U.S. monetary policy or a new regulatory framework could dramatically alter Bitcoin’s trajectory. Similarly, events such as geopolitical instability or a major economic downturn could trigger rapid shifts in investor behavior, regardless of technical indicators.
Market behavior can shift quickly, especially during periods of high volatility. The market’s response to external shocks may not align with traditional technical patterns, making it essential for investors to remain flexible and monitor a broad range of indicators.
For real-time updates on Bitcoin and crypto markets, visit the original source.
Sources & further reading
Featured image: Bitcoin crypto currency 8K wallpaper.jpg by Satheesh Sankaran, CC BY-SA 2.0, via Wikimedia Commons. Image source · License